


Market Update 06-10-2024
THE BIG PICTURE:
The current tally of our indicators that are ‘Up’ for U.S. Equities is that all four are Positive. These represent a multitude of timeframes:
- LONG-TERM CYCLICAL BULL/BEAR — POSITIVE since April 21, 2023
- MIDTERM/QUARTERLY — POSITIVE since January 1, 2024
- SHORT-TERM — POSITIVE since November 16, 2023
- SHORT-TERM — POSITIVE since November 21, 2023
When all four of our indicators are in a POSITIVE status, we read the market as being in a CYCLICAL BULL MARKET
U.S. MARKET INDEXES OVERVIEW

THE DOW JONES INDUSTRIAL AVERAGE (DJIA) is the oldest continuing U.S. market index with over 100 years of history and is made up of 30 highly reputable “blue-chip” U.S. stocks (e.g. Coca-Cola Co., Microsoft).
The Dow shows slight improvement over last week, ending the week of June 7th up .29% to end at 38,798.99 vs the prior week of 38,686.32.
THE NASDAQ COMPOSITE INDEX tracks most of the stocks listed on the Nasdaq Stock Market - the second-largest stock exchange in the world. Over half of all stocks on the NASDAQ are tech stocks.
The tech-driven Nasdaq joined the Dow in a slight rally this week. NASDAQ was up 2.38% by closing this week, ending at 17,133.13 vs. the prior week of 16,735.02.
THE S&P 500 LARGE-CAP INDEX is a market-capitalization-weighted index of 500 leading publicly traded companies in the U.S. The S&P 500 is regarded as one of the best gauges of prominent American equities' performance, and by extension, that of the stock market overall.
S&P 500 was up 1.32%, closing at 5346.99 compared to last week’s 5277.51.
THE S&P 400 MID-CAP INDEX is the benchmark index made up of 400 stocks that broadly represent companies with midrange market capitalization between $3.6 billion and $13.1 billion. It is used by investors as a gauge for market performance and directional trends in U.S. stocks.
The S&P 400 mid-cap was down -2.08% this week. It went from last week’s close of 2982.86 to 2920.70.
THE RUSSELL 2000 (RUT) SMALL-CAP INDEX measures the performance of the 2,000 smaller companies included in the Russell 3000 Index. The Russell 2000 is managed by London's FTSE Russell Group and is widely regarded as a leading indicator of the U.S. economy because of its focus on smaller companies that focus on the U.S. market.
The Russel 2000 joined the midcap index in the red this week. It was down -2.11% for the week, closing at 2026.55 compared to last week’s 2070.13.
U.S. COMMODITIES / FUTURES OVERVIEW
Commodities continued the downtrend, showing poor performance across the board.

THIS WEEK’S ECONOMIC NEWS
FOR THE U.S. MARKET
Manufacturing slump continues…
The start of the week brought some downbeat economic readings, which appeared to lead to a return of worries about slowing growth alongside high inflation—or “stagflation”—among some investors, according to our traders. In particular, the Institute for Supply Management (ISM) reported on Monday that its gauge of manufacturing activity had fallen further into contraction territory (48.7, with levels below 50.0 indicating contraction).
On Tuesday, the Labor Department reported that job openings in April had fallen to their lowest level (8.059 million) since February 2022. Conversely, the number of Americans leaving their jobs voluntarily, the so-called quits rate—considered by many as a more reliable indicator of the strength of the labor market—surprised on the upside.
…as services sector remains strong
The picture arguably brightened at midweek, however. The ISM’s services jumped to 53.8 in May, its highest level in nine months and well above consensus expectations. On the same day, payroll processor ADP reported its tally of private sector job gains, which fell to 152,000, the lowest level in four months. Our traders noted that the twin reports seemed to help replace the stagflation narrative with a possible “Goldilocks” scenario of growth that was neither too hot nor too cold in the minds of many investors.
The upside surprise in the Labor Department’s official jobs report on Friday morning appeared to derail this narrative, but only temporarily. According to its broader tally of both private sector and government nonfarm jobs, employers added 272,000 jobs in May, well above consensus expectations and the most since the start of the year. The market's reaction to the news may have been tempered by an unexpected rise in the unemployment rate to 4.0%, its highest level since January 2022.
Mixed inflation signals
The week’s inflation signals were also mixed. Even as the unemployment rate increased, average hourly earnings rose 0.4%, above consensus and the most since January. The ISM data suggested that overall price pressures were concentrated in the much larger services sector while easing in the struggling manufacturing sector, due largely to falling commodity prices.
On balance, fixed income investors appeared to interpret the news as signs of easing inflation pressures. The yield on the benchmark 10-year U.S. Treasury note hit an over two-month intraday low (4.28%) on Thursday. While the yield jumped after the Friday jobs report, it still ended lower for the week. (Bond prices and yields move in opposite directions.) Our traders noted that cheaper ratios relative to Treasuries and cash from June coupon payments provided additional support to the tax-free municipal market.
Meanwhile, our traders noted that spreads in the investment-grade corporate bond market widened over the course of the week. Issuance was slightly above expectations, though a large number of issues were oversubscribed. On the other hand, the high yield market benefited from the rally in tech stocks.
LAST 52 WEEKS OF THE VOLITILIY INDEX (VIX)
VIX closed at 12.22 this week, a 5.4% decrease over last week’s close of 12.22.

THE CAPE THIS YEAR (2024)
34.82 – up 1.22% for the month of June


NOTE: WE DO NOT USE CAPE AS AN OFFICIAL INPUT INTO OUR METHODS. HOWEVER, WE THINK HISTORY SERVES AS A GUIDE AND THAT IT’S GOOD TO KNOW WHERE WE ARE ON THE HISTORIC CONTINUUM.
INTERNATIONAL MARKETS

Europe
In local currency terms, the pan-European STOXX Europe 600 Index ended 1.04% higher after the European Central Bank (ECB) on Thursday cut interest rates for the first time in five years. Major stock indexes recorded gains. Italy’s FTSE MIB rose 0.49%, Germany’s DAX tacked on 0.32%, and France’s CAC 40 Index added 0.11%. The UK’s FTSE 100 Index slipped 0.36%.
ECB cuts rates, but no hint on future decisions
The ECB reduced its deposit rate by a quarter point to 3.75%, as expected, but it stopped short of indicating that more cuts could follow. “Based on an updated assessment of the inflation outlook, the dynamics of underlying inflation and the strength of monetary policy transmission, it is now appropriate to moderate the degree of monetary policy restriction after nine months of holding rates steady,” the Governing Council said in a statement. However, reading from the statement at a press conference, ECB President Christine Lagarde added: “We are not pre-committing to a particular rate path. Despite the progress over recent quarters, domestic price pressures remain strong as wage growth is elevated, and inflation is likely to stay above target well into next year.”
The ECB forecast that inflation would average 2.5% in 2024, an upward revision from the previous estimate of 2.3%. The central bank also revised its estimate of average inflation for 2025 to 2.2% in 2025 from 2.0% but held its forecast for 2026 at 1.9%.
Wieladek: Two more ECB rate cuts likely, but moves will depend on forecasts
T. Rowe Price European Economist Tomasz Wieladek notes that Lagarde indicated that the inflation data presented a mixed picture. Importantly, the ECB president highlighted that underlying inflation slowed again in April and that company profit margins were starting to absorb wage growth. She also said that the Governing Council’s confidence in the inflation forecast drove the ECB’s decision. Lagarde said that the road ahead will be bumpy, implying that policymakers will change with the data. Wieladek sees the potential for two additional rate cuts this year, most likely in September and December—although this purely data-dependent approach means that there might only be one.
Danish central bank cuts rates
Denmark's central bank lowered its benchmark rate by a quarter point to 3.35%, following the ECB’s move.
Japan
Japan’s stock markets generated mixed weekly returns, with the Nikkei 225 Index up 0.5% and the broader TOPIX Index falling 0.6%. A tentative rally in the yen, which strengthened to around JPY 155 against the U.S. dollar, from the prior week’s JPY 157, posed a headwind for Japanese exporters. However, the latest purchasing managers’ index data showing that the country’s services sector continued to expand at a sharp pace in May lent support to sentiment. There were also some signs that private consumption could stop being a drag on growth, as household spending increased year on year in April, the first increase in 14 months.
Bank of Japan expected to taper bond buying, keep interest rates unchanged
In the fixed income markets, the yield on the 10-year Japanese government bond (JGB) fell to 0.98%, from 1.07% at the end of the previous week, tracking U.S. Treasury yields lower. Speculation was rife that the Bank of Japan (BoJ) would taper its bond buying at its next monetary policy meeting on June 13–14, allowing markets to drive rates more, in a further shift away from its highly stimulative policy stance. BoJ Governor Kazuo Ueda has asserted that the central bank would be ready to step in to avoid a sharp tightening in financial conditions, however.
With regards to raising interest rates, Ueda said that the BoJ would move cautiously to avoid making any big mistakes. While it is widely expected to keep interest rates unchanged at its June meeting, it is likely to keep taking incremental tightening steps, given improving global growth and Japan’s inflation trends.
Finance Ministry confirms currency intervention to prop up the yen
Japan’s Finance Minister Shunichi Suzuki confirmed that his ministry had intervened in the foreign exchange market in the period from April 29 to May 29 to counter excessive currency moves. He deemed the yen-buying to have had some effect. The efficacy of such interventions in propping up the historically weak yen is limited by the wide U.S.-Japan interest rate differential, which is likely to keep weighing on the Japanese currency.
China
Stocks in China retreated despite data showing that the property sector may be gaining traction. The Shanghai Composite Index declined 1.15%, while the blue chip CSI 300 Index gave up 0.16%. In Hong Kong, the benchmark Hang Seng Index rose 1.59%, according to FactSet.
The value of new home sales by the country’s top 100 developers rose 11.5% in May, up from April’s 3.4% increase, according to the China Real Estate Information Corp. New home sales slumped 33.6% in May from a year ago but eased from April’s 45% decline. The data boosted hopes that China’s property market downturn, now in its fourth year, may start to recover after Beijing announced a rescue package in May to stabilize the struggling sector. However, some analysts remained skeptical about whether the measures will result in a sustainable housing recovery amid weak domestic demand.
In economic news, the private Caixin/S&P Global survey of manufacturing activity edged up to 51.7 in May from April’s 51.4, marking its seventh monthly expansion. Readings above 50 indicate an expansion from the prior month. The Caixin services purchasing managers’ index reached an above-consensus 54 in May, rising from 52.5 in April. The private Caixin survey, which focuses on smaller and export-oriented firms, contrasted with official data the prior week showing that manufacturing activity unexpectedly contracted in May.
Exports exceed forecasts
China’s exports rose a better-than-expected 7.6% in May from a year earlier, up from 1.5% growth in April. Imports increased a weaker-than-expected 1.8% in May, slowing from April’s 8.4% rise. The overall trade surplus increased to USD 82.62 billion, up from USD 72.35 billion in April. While strong overseas demand has driven China’s exports despite the threat of new tariffs, analysts noted that the disappointing imports growth indicated weak consumer spending at home.
South Africa
Post-election coalition discussions are likely to be complex
On Wednesday, May 29, South Africa held its general elections, and the ruling African National Congress (ANC) political party—which has held power for three decades—performed worse than expected. Although the ANC lost its majority, it did win the most seats (about 40%) in the National Assembly, which, according to T. Rowe Price analyst Roy Adkins, puts it in a strong position in coalition negotiations with other parties. However, given the ANC’s previous dominance, most parties are relatively inexperienced in these types of negotiations, so Adkins expects political uncertainty and market volatility to prevail in the weeks ahead.
Adkins expects coalition discussions to be influenced by three primary factors: a desire for influence at the national level, the interaction of potential for joining a national level coalition with the potential for joining a coalition in the provincial level governments, and internal party dynamics. Balancing these three primary factors will make for very complex negotiations that will take time to complete and could generate significant swings in market sentiment.
THIS WEEK’S HIGHLIGHTED STORY
https://www.visualcapitalist.com/the-worlds-largest-economies-comparing-the-u-s-and-china/
MAY 27, 2024
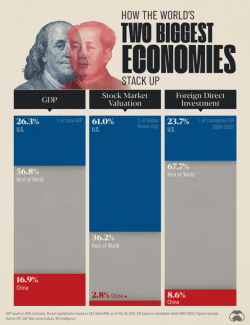
Comparing the Economies of U.S. and China in 3 Key Metrics
Starting with GDP, we used 2024 estimates from the latest edition of the IMF’s World Economic Outlook (April 2024):
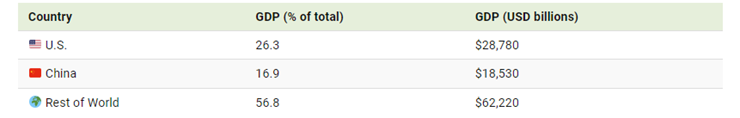
Based on these figures, the United States and China combine for a massive 43.2% share of the global economy. It’s also interesting to note that America’s share of global GDP has actually been increasing in recent years, from a low of 21.1% in 2011. This is partly due to its relatively strong recovery from the COVID-19 pandemic.
Equity Market Valuation
The U.S. dominates when it comes to stock market valuation, accounting for 61% of the global total as of Feb. 29, 2024. These figures are based on each country’s share of the S&P Global BMI, which is a broad coverage index, including large, mid, and small-cap stocks from developed and emerging markets.
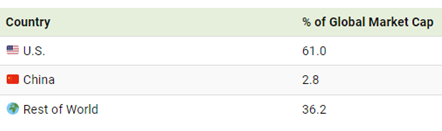
The massive disparity in equity market valuations between the U.S. and China is a result of differences in many factors, including market maturity, corporate governance, and international participation. In terms of country rankings within the S&P Global BMI, China is the fourth largest (behind Japan and the UK).
Foreign Direct Investment
FDI is an investment made by a firm or individual in one country into business interests located in another country. This type of investment can be very beneficial because it can create jobs and enhance economic growth. The FDI figures in this graphic were sourced from fDi Intelligence, and represent cumulative FDI stock from 1990 to 2022.
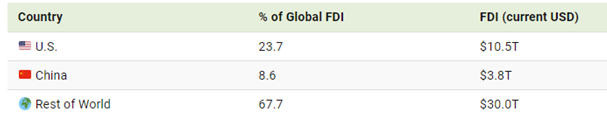
The U.S. and China are first and second in terms of cumulative FDI stock. Attracting FDI is one area where China has performed very strongly in recent years.
For example, in 2012, China had attracted $950 billion in FDI, good enough for sixth place. As of 2022, China’s total had grown to $3.8 trillion, a testament to its attractiveness to global businesses, even in the face of regulatory challenges and geopolitical tensions
Sources:
All index and returns data from Norgate Data and Commodity Systems Incorporated and Wall Street Journal. News from Reuters, Barron’s, Wall St. Journal, Bloomberg.com, ft.com, guggenheimpartners.com, zerohedge.com, ritholtz.com, markit.com, financialpost.com, Eurostat, Statistics Canada, Yahoo! Finance, stocksandnews.com, marketwatch.com, visualcapitalist.com, wantchinatimes.com, BBC, 361capital.com, pensionpartners.com, cnbc.com, FactSet, Morningstar/Ibbotson Associates, Corporate Finance Institute.
Commentary from T Rowe Price Global markets weekly update — https://www.troweprice.com/personal-investing/resources/insights/global-markets-weekly-update